VISLIZ / Worked examples · Updated 2026-10-16
Regional order comparison example
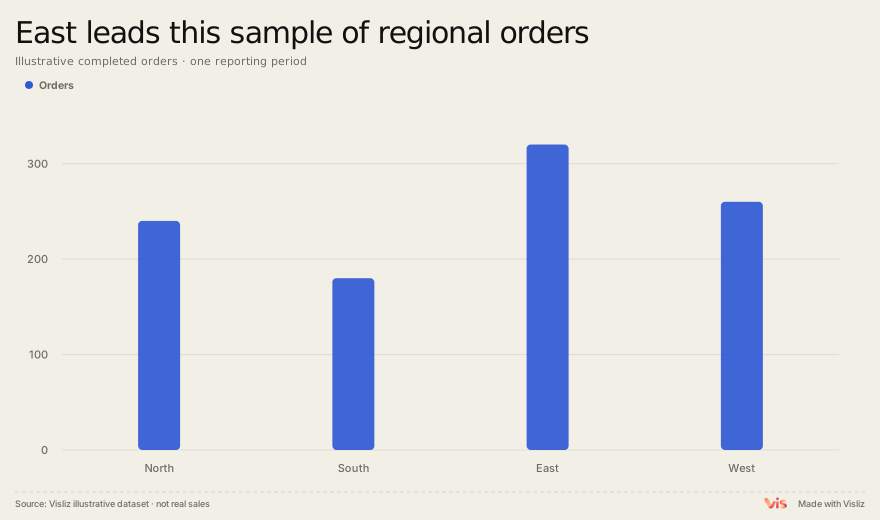
Compare 1,000 orders across four regions with a bar chart, highlighting East at 320 orders and South at 180.
Animated chart demo
Play the exported chart, follow its reveal, then replay. Open the Interactive SVG to explore the chart.
What the sample shows
The four sample regions total 1,000 orders. East has 320 and South 180, a difference of 140 orders. This is a comparison of counts, not a measure of regional conversion rates or population-adjusted performance.
Data source and method
The complete sample table is available below. Use one reporting period and the same definition of a completed order. Preserve a zero baseline for bar lengths. Do not rank a region as more efficient without a denominator such as visits, customers or spend.
Region,Orders
North,240
South,180
East,320
West,260
Reproduce this chart
Compare the tallest and shortest bars, check the scale, and download the underlying four-row table. Reuse the bar template for your own regions.
