VISLIZ / Worked examples · Updated 2026-10-16
NASA GISTEMP: annual temperature anomalies, 2015–2024
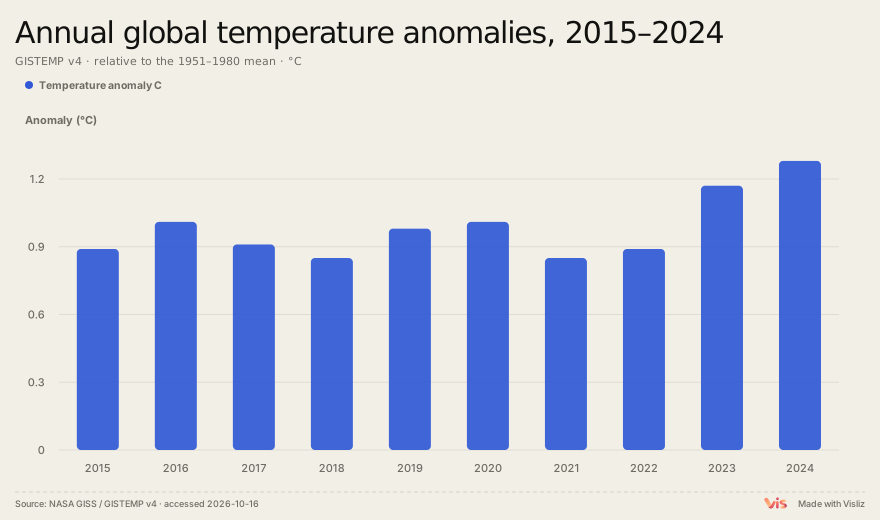
Build a bar chart from NASA’s published annual J-D values and explain the 1951–1980 baseline.
Play the exported chart
Real public-data snapshot, accessed 2026-10-16. Source, coverage and methods are described below.
Read anomalies relative to the baseline
The 2024 value in this snapshot is 1.28°C above the 1951–1980 reference mean. That is a temperature anomaly, not an absolute global temperature of 1.28°C. The selected chart covers ten annual observations, 2015–2024; the example uses this fixed period.
Use the published annual mean
Read the J-D column from NASA’s GISTEMP v4 Global Land-Ocean Temperature Index CSV and select 2015–2024. Do not average already-rounded monthly values to reconstruct J-D. All bars represent one year with the same reference period; the zero line means the reference mean, not zero physical temperature.
Citation and uncertainty
GISTEMP Team, 2026: GISS Surface Temperature Analysis, version 4, NASA GISS, accessed 2026-10-16. Also cite Lenssen et al. (2024), A GISTEMPv4 observational uncertainty ensemble, doi:10.1029/2023JD040179. This example plots point estimates without uncertainty bands; consult the original analysis for uncertainty and later revisions.
Sources and downloadable inputs
| Year | Temperature anomaly C |
|---|---|
| 2015 | .89 |
| 2016 | 1.01 |
| 2017 | .91 |
| 2018 | .85 |
| 2019 | .98 |
| 2020 | 1.01 |
| 2021 | .85 |
| 2022 | .89 |
| 2023 | 1.17 |
| 2024 | 1.28 |
Use this template ↗Download CSVDownload Interactive SVG

Reproduce it in the editor
Use the template to load this exact CSV and chart type. Inspect the preview, units and source, then export the actual file. Source field names remain in English for verification. If you change the selection or rounding, recalculate any numeric statements in the title.