VISLIZ / Worked examples · Updated 2026-10-16
Show conversion changes with a slope chart
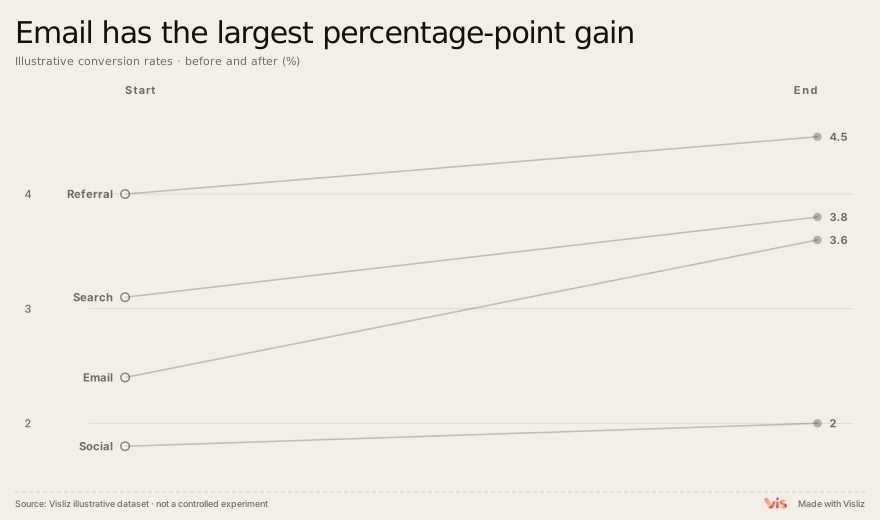
Compare conversion rates across four channels and explain Email’s change from 2.4% to 3.6% as 1.2 percentage points.
Animated chart demo
Play the exported chart, follow its reveal, then replay. Open the Interactive SVG to explore the chart.
What the sample shows
Email gains 1.2 percentage points, Search 0.7, Social 0.2 and Referral 0.5. Email has the largest absolute percentage-point increase, while Referral still has the highest final rate at 4.5%. These are two different comparisons.
Data source and method
The complete sample table is available below. Keep each channel’s before and after rate on the same scale. Subtract the before rate from the after rate to calculate percentage-point change. Sample sizes and uncertainty are not provided, so do not claim statistical significance or a causal uplift.
Channel,Before,After
Email,2.4,3.6
Search,3.1,3.8
Social,1.8,2.0
Referral,4.0,4.5
Reproduce this chart
Replay the two-point comparison and inspect endpoints. Use the accompanying table to distinguish final level from change. Replace the illustrative rates with properly defined observations.
