VISLIZ / Worked examples · Updated 2026-10-16
World Bank life expectancy: compare 2000 with 2022
Compare life expectancy in six countries in 2000 and 2022 with a slope chart, World Bank data and a reusable template.
Play the exported chart
Real public-data snapshot, accessed 2026-10-16. Source, coverage and methods are described below.
Compare endpoints, not a causal effect
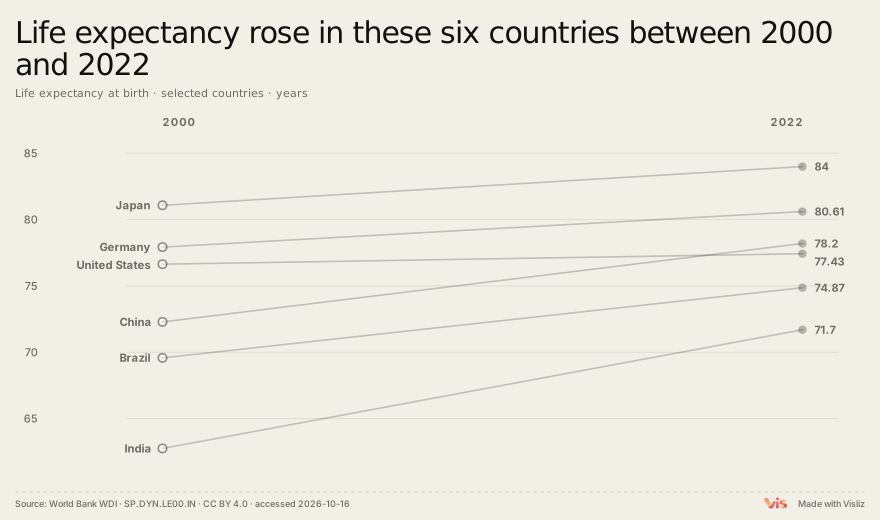
Each line joins the same country’s 2000 and 2022 life expectancy at birth. The countries are Brazil, China, Germany, India, Japan and the United States. All six selected endpoints rise in this snapshot, but the selection is not a representative global sample or a ranking of health systems.
Make a reproducible two-column comparison
The source API request retrieves indicator SP.DYN.LE00.IN for these six country codes for 2000–2022. Keep only the two endpoint years, require non-null values, and round each displayed value to two decimal places for CSV and chart labels. Intermediate years remain in the original JSON but are not shown by a two-point slope chart.
Attribution and limits
Source: World Bank, World Development Indicators, Life expectancy at birth, total (years), SP.DYN.LE00.IN, CC BY 4.0. API source last updated 2026-10-08; accessed 2026-10-16. Values are statistical estimates and can be revised. Life expectancy at birth is not the observed lifespan of every individual, and endpoints alone do not explain a policy effect.
Sources and downloadable inputs
| Country | 2000 | 2022 |
|---|---|---|
| Brazil | 69.58 | 74.87 |
| China | 72.29 | 78.20 |
| Germany | 77.93 | 80.61 |
| India | 62.75 | 71.70 |
| Japan | 81.08 | 84.00 |
| United States | 76.64 | 77.43 |
Use this template ↗Download CSVDownload Interactive SVG

Reproduce it in the editor
Use the template to load this exact CSV and chart type. Inspect the preview, units and source, then export the actual file. Source field names remain in English for verification. If you change the selection or rounding, recalculate any numeric statements in the title.