VISLIZ / Templates · Updated 2026-10-16
Slope chart template
Use a slope chart to explain before-and-after changes, with sample data and percentage-point guidance.
Use this template ↗Download CSVInteractive SVG

When to use it
Show how several comparable groups changed between exactly two observations.
Prepare your data
Use a label column followed by the before and after values. Compare like-for-like populations. For percentages, distinguish percentage-point change from relative percent change.
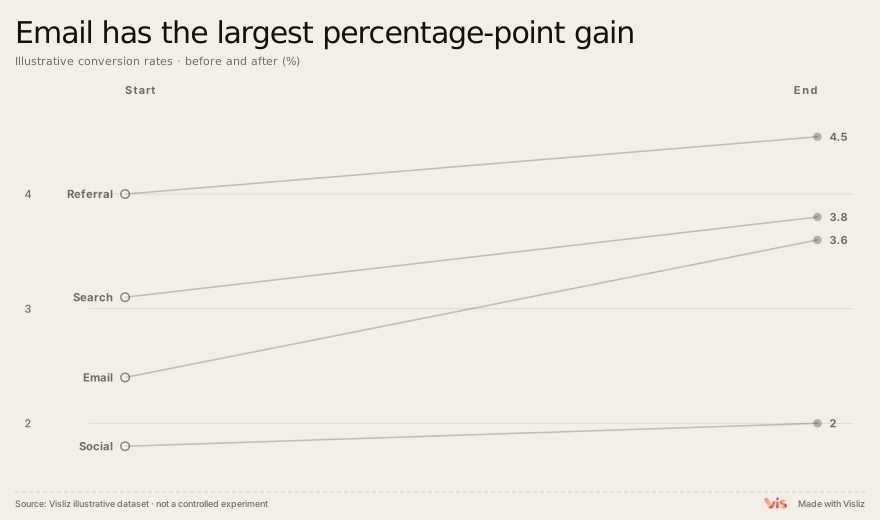
Channel,Before,After
Email,2.4,3.6
Search,3.1,3.8
Social,1.8,2.0
Referral,4.0,4.5
Make and deliver the chart
- Open this template and replace the sample table in the editor.
- Check units, labels, title, source and preview. Use the annotation controls where context is needed.
- Export SVG or PNG. For supported interactions, choose Interactive SVG. Sign in to open the editor, save to the cloud or publish a public link.
Limits and interpretation
Two endpoints hide intermediate volatility. A before-and-after comparison alone cannot establish causation. 2.4% to 3.6% is +1.2 percentage points, or +50% relative change. Label the measure you use.