VISLIZ / Worked examples · Updated 2026-10-16
Six-week readership chart example
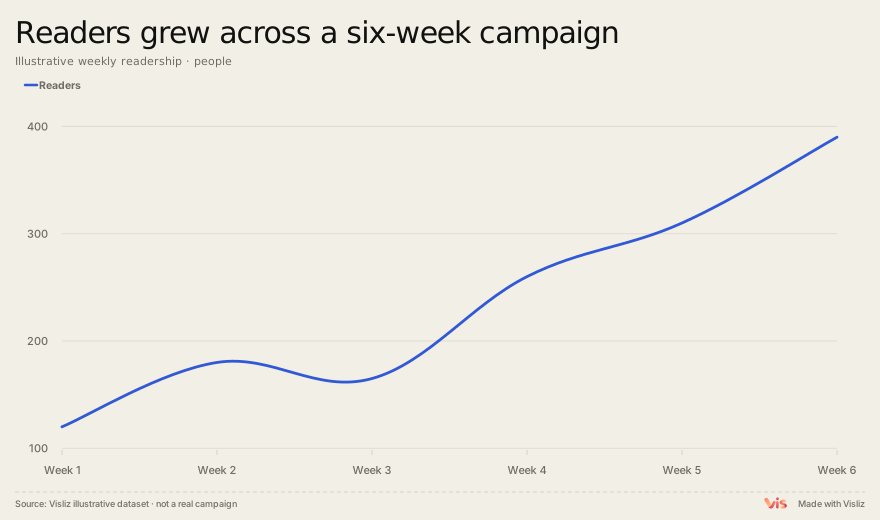
Use a line chart and annotations to show readership rising from 120 to 390, including a dip in week three.
Animated chart demo
Play the exported chart, follow its reveal, then replay. Open the Interactive SVG to explore the chart.
What the sample shows
The sample starts at 120 readers and ends at 390, an increase of 270 readers. Week 3 falls from 180 to 165 before later growth. An annotation can draw attention to that dip while keeping the observed values visible.
Data source and method
The complete sample table is available below. Keep weekly totals as supplied, preserve the week order, and compare the same readership definition in each row. No interpolation or smoothing is applied. The annotation explains the change between the selected weeks.
Week,Readers
Week 1,120
Week 2,180
Week 3,165
Week 4,260
Week 5,310
Week 6,390
Reproduce this chart
Replay the chart and follow the week labels; then inspect the downloaded CSV. Replace the sample table with your own counts to create a chart.
