VISLIZ / Templates · Updated 2026-10-16
Scatter plot template
Plot two numeric measures with a scatter template, downloadable data and guidance on interpretation.
Use this template ↗Download CSVInteractive SVG

When to use it
Explore association, spread and outliers across paired numeric observations.
Prepare your data
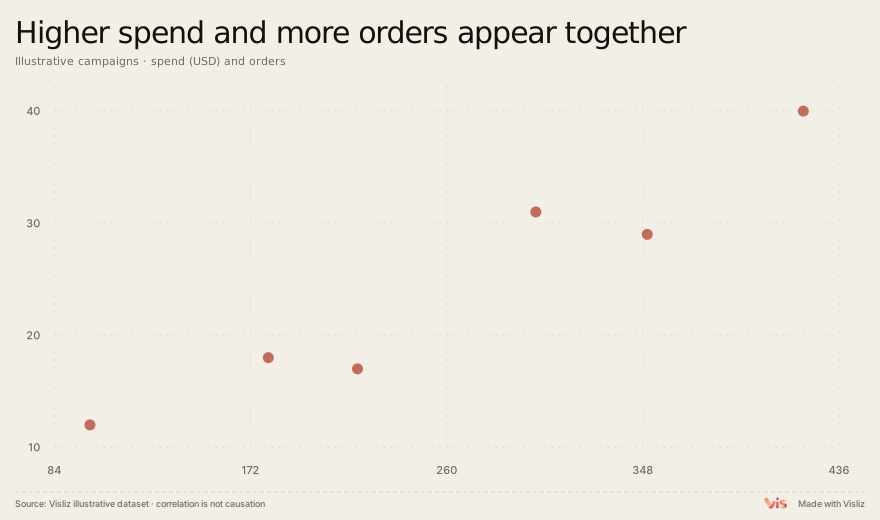
Use a row identifier plus two numeric columns. Label both axes with units and check that each row measures the same entity over a comparable period.
Campaign,Spend,Orders
A,100,12
B,180,18
C,220,17
D,300,31
E,350,29
F,420,40
Make and deliver the chart
- Open this template and replace the sample table in the editor.
- Check units, labels, title, source and preview. Use the annotation controls where context is needed.
- Export SVG or PNG. For supported interactions, choose Interactive SVG. Sign in to open the editor, save to the cloud or publish a public link.
Limits and interpretation
Check axis units and use comparable observations. A scatter plot shows association and outliers; a causal explanation requires additional evidence.