VISLIZ / Templates · Updated 2026-10-16
Donut chart template
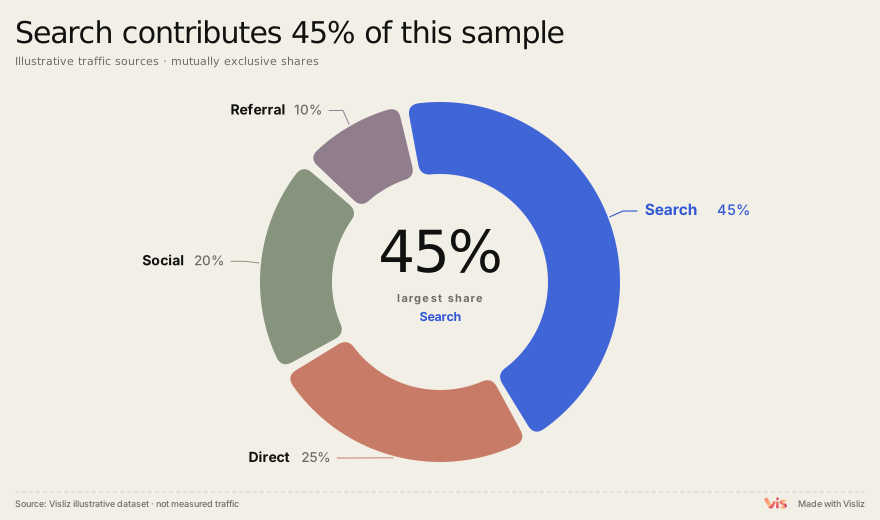
Create a donut chart for parts of a whole, using a sample that sums to 100% and a reusable template.
Use this template ↗Download CSVInteractive SVG

When to use it
Show a small number of mutually exclusive parts of a meaningful whole.
Prepare your data
List each category once with its share. Confirm whether the values are percentages or counts and check the total. Keep the category set consistent across comparisons.
Source,Share
Search,45
Direct,25
Social,20
Referral,10
Make and deliver the chart
- Open this template and replace the sample table in the editor.
- Check units, labels, title, source and preview. Use the annotation controls where context is needed.
- Export SVG or PNG. For supported interactions, choose Interactive SVG. Sign in to open the editor, save to the cloud or publish a public link.
Limits and interpretation
Do not mix overlapping audiences or negative values. Use a bar chart when precise comparisons matter more than part-to-whole composition. The example sums to 100%. Missing categories can make a share chart misleading.